12. Hyperparameters in the input
This section is a bit technical, I will explain a nonobvious thing necessary to
make empbayes_fit work when the hyperparameters enter in the definition
of the Gaussian process from the input points instead of from the kernel
parameters and the input points are multidimensional.
Let’s say you are investigating on a case of disappeared cats in a village. You want to study the correlation between the number of new cars bought per day and the number of reported disappeared cats per day.
To make it quick, I’ll first write the model and then generate the fake data from it for some value of the hyperparameters, then we’ll check if the fit recovers the correct hyperparameters.
import numpy as np
import gvar
import lsqfitgp as lgp
from matplotlib import pyplot as plt

def makepoints(time):
    points = np.empty((2, len(time)), dtype=[
        ('time', float),
        ('series', int)  # 0 = cats, 1 = cars
    ])
    points['time'] = time
    points['series'] = np.arange(2)[:, None]
    return points

time = np.arange(20)

def makegp(hp):
    delay = hp['delay']
    corr = hp['corr']
    scale = hp['scale']

    kernel = lgp.ExpQuad(dim='time', scale=scale)
    cov = np.array([[1, corr], [corr, 1]])
    kernel *= lgp.Categorical(dim='series', cov=cov)

    gp = lgp.GP(kernel)

    points = makepoints(time)
    points['time'][0] -= delay
    return gp.addx(points, 'data')

truehp = {
    'delay': 10,
    'corr': 0.70,
    'scale': 3
}

gp = makegp(truehp)
prior = gp.prior('data')
data = gvar.sample(prior)

fig, ax = plt.subplots(num='lsqfitgp example')

ax.plot(time, data[0], '.k', label='cats')
ax.plot(time, data[1], 'xk', label='cars')
ax.legend()

fig.savefig('hyperstruct1.png')
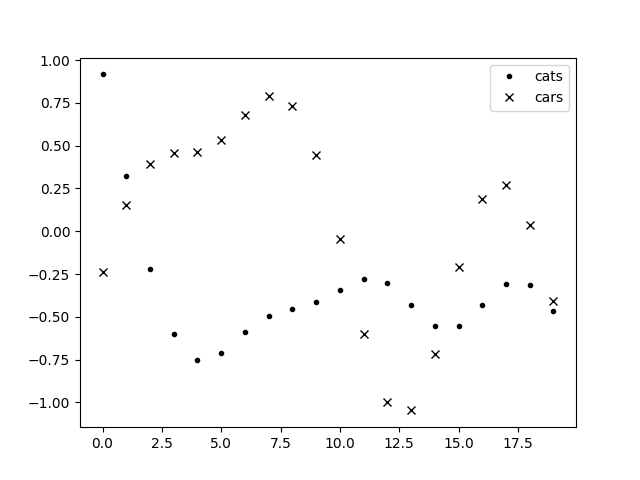
You can see that cats seem to reproduce the trend of cars but with a delay. Let’s fit now:
hprior = lgp.copula.makedict({
    'delay': gvar.gvar(10, 5),
    'corr': lgp.copula.uniform(-1, 1),
    'log(scale)': gvar.log(gvar.gvar(3, 1)),
})

fit = lgp.empbayes_fit(hprior, makegp, {'data': data})
I used copula.makedict to generate automatically the transformation of the
parameter 'corr'. When I run this last piece of code, it fails with:
jax._src.errors.TracerArrayConversionError: The numpy.ndarray conversion method __array__() was called on the JAX Tracer object ...
Ok, what went wrong? First, I used np.array() in makegp without doing
from jax import numpy. Second, I did points['time'][0] -= delay,
which is an inplace operation, which is not allowed by jax. Fixing the
first is easy, but how do we fix the second? There isn’t an obvious way to put
values into a numpy structured array without assigning to it. For this reason,
lsqfitgp provides a wrapper, StructuredArray, that allows
assigning to fields without breaking jax:
from jax import numpy as jnp

def makegp(hp):
    delay = hp['delay']
    corr = hp['corr']
    scale = hp['scale']

    kernel = lgp.ExpQuad(dim='time', scale=scale)
    cov = jnp.array([[1, corr], [corr, 1]]) # <- jax numpy
    kernel *= lgp.Categorical(dim='series', cov=cov)

    gp = lgp.GP(kernel)

    points = makepoints(time)
    points = lgp.StructuredArray(points)
    points = points.at['time'].set(jnp.array([time - delay, time]))
    #                              ~~~ jax numpy
    # this creates a copy of the array with the modified field
    return gp.addx(points, 'data')

fit = lgp.empbayes_fit(hprior, makegp, {'data': data}, raises=False)
    # we use raises=False because the minimizer is a bit picky.

for k in truehp:
    print(k, truehp[k], fit.p[k])
Output:
delay 10 8.98(58)
corr 0.7 0.67(15)
scale 3 3.107(49)
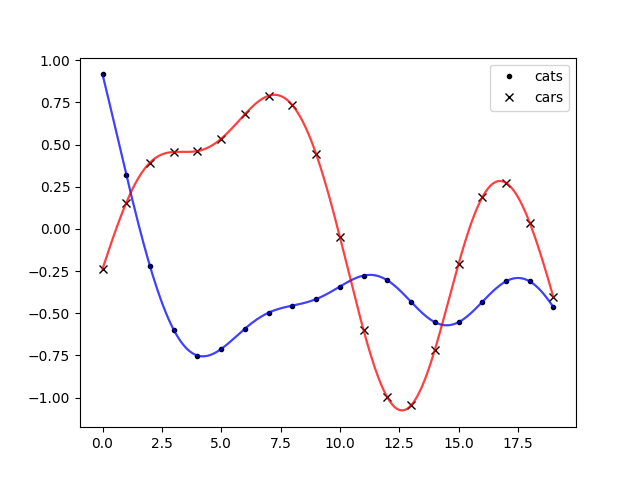
It seems to work. Let’s plot some samples:
timeplot = np.linspace(0, 19, 200)
xplot = makepoints(timeplot)

for hpsamp in gvar.raniter(fit.p, 2):
    xplot[0]['time'] = timeplot - hpsamp['delay']
    gp = makegp(hpsamp).addx(xplot, 'plot')
    yplot = gp.predfromdata({'data': data}, 'plot')

    for sample in gvar.raniter(yplot, 1):
        ax.plot(timeplot, sample[0], color='blue', alpha=0.5)
        ax.plot(timeplot, sample[1], color='red', alpha=0.5)

fig.savefig('hyperstruct2.png')
For better tidiness we should have put subtracting the delay from the time
array for cats into the function makepoints.