8. Partial derivatives
Now that we can represent Multidimensional input, we can also take partial derivatives. In the last example in Taking derivatives, we imposed that the unknown function ought to have a local maximum in zero. Here we’ll try to impose that a function of two variables has a saddle point in the center. Let’s say that the function has value 0 at the four corners of the unitary square:
import numpy as np
import lsqfitgp as lgp
import gvar

gp = lgp.GP(lgp.ExpQuad(scale=0.25))

xydata = np.array([
    (0, 0),
    (0, 1),
    (1, 0),
    (1, 1),
], dtype=[('x', float), ('y', float)])

zdata = np.zeros(4)

gp = gp.addx(xydata, 'corners')
Next, we have to specify the saddle point using derivatives. For simplicity,
let’s say that the saddle point is oriented along the axes and fix that the
curvature is negative along x and positive along y. This implies that:
the second derivatives w.r.t.
xandyare respectively negative and positive;the cross second derivative is zero;
the first derivatives are zero.
To specify partial derivatives, we pass a field name, a tuple of field names, or
a pair (order, field name) as deriv argument to addx:
center = np.array((0.5, 0.5), dtype=xydata.dtype)
gp = (gp
    .addx(center,   'dx', deriv=       'x')
    .addx(center,   'dy', deriv=       'y')
    .addx(center,  'd2x', deriv=('x', 'x'))
    .addx(center,  'd2y', deriv=(  2, 'y'))
    .addx(center, 'dxdy', deriv=('x', 'y'))
)
Now we add a grid of points to do the plot and then ask for the prediction:
xyplot = np.empty((30, 30), dtype=xydata.dtype)
xyplot['x'] = np.linspace(0, 1, xyplot.shape[0])[:, None]
xyplot['y'] = np.linspace(0, 1, xyplot.shape[1])[None, :]

gp = gp.addx(xyplot, 'plot')

zplot = gp.predfromdata({
    'corners': zdata,
    'dx'     : 0,
    'dy'     : 0,
    'd2x'    : gvar.gvar(-1, 0.3),
    'd2y'    : gvar.gvar( 1, 0.3),
    'dxdy'   : 0,
}, 'plot')
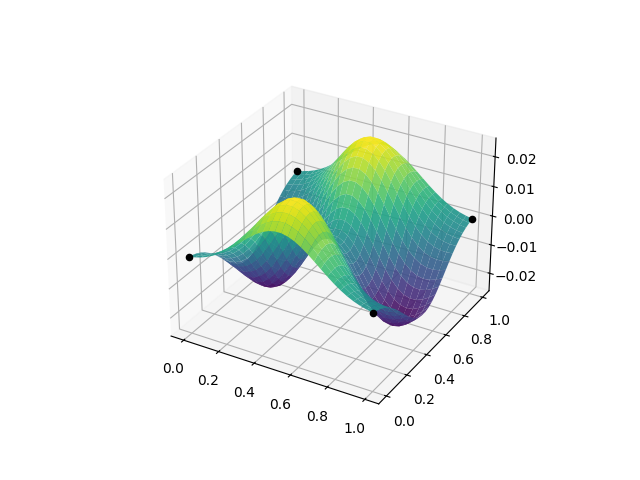
And plot it:
from matplotlib import pyplot as plt

fig, ax = plt.subplots(num='lsqfitgp example', subplot_kw=dict(
    projection='3d',
    computed_zorder=False,
))

ax.plot_surface(xyplot['x'], xyplot['y'], gvar.mean(zplot), cmap='viridis', alpha=0.9)
ax.scatter(xydata['x'], xydata['y'], zdata, c='black', depthshade=False, zorder=10)

fig.savefig('partial1.png')
In general to specify a partial derivative you have to define a floating point
named field in your input array and use the field name to specify the derived
variable. For the full derivative specification syntax, see the reference for
Deriv.